Eco-lesson from Covid-19
By gofb-adm on Wednesday, July 1st, 2020 in Issue 2 - 2020, Cover Story No Comments


By gofb-adm on Wednesday, July 1st, 2020 in Issue 2 - 2020, Cover Story No Comments
The global economy will look vastly different in the aftermath of the coronavirus pandemic, which has claimed over 200,000 lives worldwide at the time of writing. Many countries have unveiled stimulus packages to help keep their economies afloat. Malaysia is no exception, with its US$57 billion stimulus package – a substantial sum for an economy of its size.
Read more »By gofb-adm on Wednesday, July 1st, 2020 in Issue 2 - 2020, Markets No Comments
Pakistan's oleochemicals market is estimated at 164,640 tonnes per annum, consisting of 95,000 tonnes of local production (or 55% of the market share) and 74,640 tonnes of imports (45%) in 2018-19.
Read more »By gofb-adm on Wednesday, July 1st, 2020 in Issue 2 - 2020, Markets No Comments
The Dutch food processing sector generated net sales of US$391.6 billion in 2019, driven by local demand as well as growing demand from other European markets. Increased attention to product reformulation and growing food awareness of more sustainable production procedures will continue to further shape the Dutch industry in the years to come. Other consumer preferences continue to be affordability, convenience and taste. Dutch food companies are always on the lookout for new ingredients. Exporters from the US compete directly with suppliers from Europe Union (EU) member-states.
Although the Netherlands is a small country geographically, it is the gateway for US products into the EU due to the presence of the Port of Rotterdam, Amsterdam Schiphol Airport, the confluence of two major European rivers, and an excellent road and railway infrastructure.
It is the largest importing country within the EU and continues to be the second-largest exporter of agricultural products in the world, after the US and before Germany. These exports include products produced in the Netherlands as well as imported products that are re-exported, often after further processing and adding value.
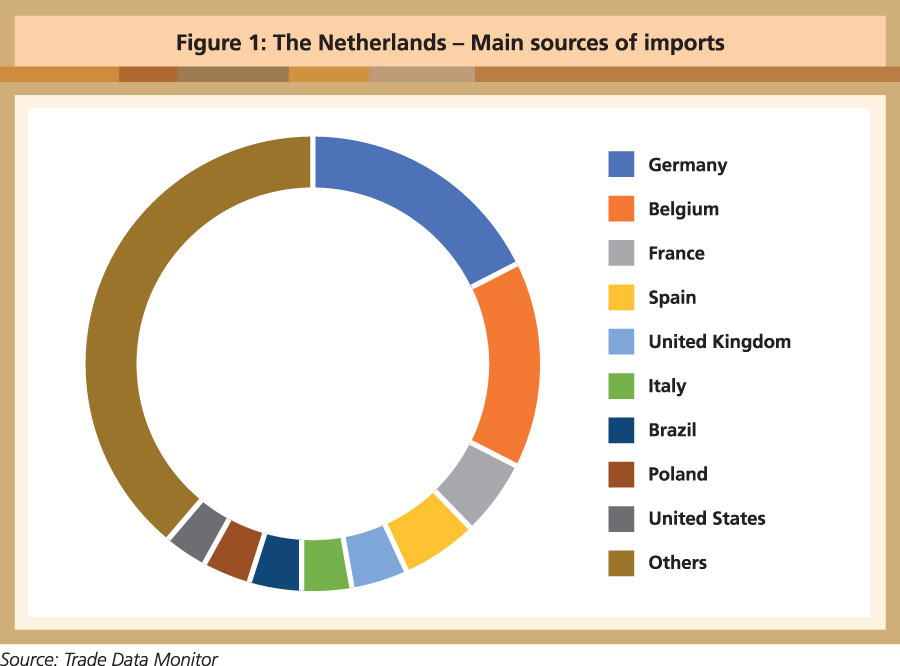
Products from other EU member-states lead Dutch imports of consumer-oriented products. In 2019, the US was the 10th largest supplier of these products to the Netherlands, with imports valued at almost US$1.3 billion (Figure 1).
Over 6,500 food companies in the Netherlands generated net sales of US$91.6 billion in 2019, up 3.5% compared to 2018. The meat, dairy and fresh produce sub-sectors each accounted for roughly a quarter of the food processing industry’s turnover.
The Dutch retail sector is rather consolidated, employing over 300,000 people and operating 4,300 stores. The net sales of the food retail industry are estimated at US$46 billion in 2019. High-end supermarkets are gaining popularity as consumers are demanding service, variety, and fresh and convenient products.
The net sales of the Dutch food service market are valued at US$24 billion. While sales in all sub-categories were up, sales in the delivery sub-category, especially for hot meals, saw a double-digit growth of 13%. In addition, consumers are seeking out products that are healthy, unique and tasty.
Business climate
Fundamental strengths of the economy continue to be the Netherlands’ stable political climate, highly developed financial sector, strategic location, a well-educated and productive labour force, and high-quality physical and communications infrastructure.
The Netherlands Bureau for Economic Policy Analysis (CPB), recently adjusted the country’s economic outlook due to the Covid-19 pandemic. The CPB used four scenarios to outline the possible economic impact of the coronavirus in 2020 and 2021. The scenarios used different starting points with respect to the duration of the physical contact restrictions and the severity of the economic impact.
All the scenarios resulted in a recession, with GDP declining by between 1.2% and 7.7% in 2020. In its mildest scenario, the economy will rebound as early as in the third quarter of 2020; in its gravest scenario, problems will expand to also include the financial sector as the situation abroad continues to worsen. This last scenario also projects GDP to decrease by 2.7% in 2021. Under three of the four scenarios, the economic downturn will be more severe than in the 2008-09 financial crisis.
Prior to the Covid-19 outbreak, the Dutch food processing industry was performing well. Since 2014, its net sales have grown on average by 3% per year, and its net sales in 2019 are estimated at US$91.6 billion. The industry has been a steady supplier of jobs. In 2018, roughly 144,000 people worked for a food company, and this number is expected to have grown to 148,000 in 2019 due to increased employment at small food companies (start-ups).

According to the Central Bureau of Statistics, there were 6,525 food companies in the Netherlands in 2019, up 5% compared to 2018. The increase is the result of the growing number of small food companies (with less than 10 employees), which swelled from 3,535 in 2011 to 5,265 in 2019.
Dutch food companies also operate internationally. In 2019, Dutch exports of consumer-oriented products totaled US$77.9 billion, while imports were valued at US$41.7 billion. The Dutch export surplus declined slightly to US$36.2 billion, down by US$0.3 billion compared to 2018. The leading export markets were Germany, Belgium, France, Spain and the UK, accounting for nearly 50% of food exports. However, it remains unclear, at present, what the impact of the UK leaving the EU will be with regard to its importance as a Dutch export market. The other European markets account for nearly a quarter of Dutch exports.
Increased attention to product reformulation and growing awareness of more sustainable food production procedures (in particular energy efficiency and CO2 reduction) will continue to shape the Dutch food processing industry in the years to come. Food manufacturers are increasingly experiencing pressure from society to invest in facilitating healthier choices for consumers.
The challenge is to combine healthier nutrition with other consumer needs such as affordability, convenience and taste. Through innovation and product reformulation, food companies are working on the nutritional impact of food products. They are also working on reducing salt content, saturated fats and portion sizes to make it easier for consumers to adhere to a responsible diet. On the product label, consumers can find information on the composition of the product, presence of allergens, quantity of the product, shelf-life and storage conditions.
Of the three voluntary nutrition labeling schemes, the Dutch government plans to endorse the Nutri-Score scheme from mid-2021. This scheme includes a colour-coded designation from A (best nutritional quality) to E (poorest nutritional quality). Several Dutch retailers and food companies have already voiced their support for a voluntary nutrition-labeling scheme. For example, Dutch food company HAK introduced the Nutri-score on its packaged food products in 2019.
More and more Dutch food companies are also looking at what can be done better in their factories (e.g. reducing energy and conserving water). Increasingly, they are also spending resources on having a more socially responsible purchasing policy in place for their raw materials. As a result, many have switched to sustainable alternatives for palm oil, soybean, meat, fish, coffee or cocoa.
Also, food waste, in part caused by production failures and planning errors, has gained more attention over the past few years. Food companies are endeavouring to minimise food waste, not only from a business perspective, but also from an ethical and sustainability perspective. The Netherlands government has announced that it is striving to reduce food waste by 50% by 2030. Together with the food industry and food distributors, the Ministry of Agriculture is discussing the use of ‘best before’ labels on food products. Many products which have a ‘best before’ date on the label are still edible after that date. Nevertheless, these products are often thrown away out of consumer safety concerns.

Ecologically, ethically and socially responsible production and purchasing of raw materials are an integral part of making the Dutch food industry more sustainable. Companies are increasingly delving deeper into their supply chain, working together with first, second and third suppliers to ensure sustainability throughout the supply chain. This is not easy, especially for smaller companies and in complex international supply chains.
To give a boost to the transition to International Corporate Social Responsibility (ICSR), the Dutch Food Industry signed on to the ICSR Agreement Foodstuffs, together with other food industry groups, NGOs and the government. Together, the parties are working to limit, for example, the risks of human rights violations and environmental damage, and working towards making the production chain more sustainable.
Road map to the Dutch market
Entry strategy
The first step for […] companies that would like to start exporting food ingredients to the Netherlands is to determine whether there is a potential market for their product and if the product is already available locally or in the region. It is important to gain a good understanding of where and who the buyers and end-users are. Trade statistics can help to indicate whether Dutch companies need to import this ingredient, how much is imported, and who the competing supplying countries are. If the product is new to the market, and currently not being imported, then it is recommended you reach out to Dutch traders or distributors for their input.
Import procedure
Animal and plant products are brought into the Netherlands from countries all over the world. To prevent the introduction of animal diseases or pests, and to protect the market from public health risks, the European Commission has established detailed regulations for imports from countries outside of the EU. On this basis, the Dutch Food Safety Authority performs checks on live animals, foodstuffs and plant products. Depending on the product, exporters can expect the following type of checks: a documentary check, identity check and, in some cases, a physical check.

Market structure
The Dutch food processing industry is mature, well organised, and has access to most food ingredients. Companies prefer to purchase food ingredients from specialised traders rather than sourcing directly from a foreign supplier. Only large and/or highly specialised food companies might opt to import ingredients directly from foreign suppliers, including those from the US.
Sector trends
The Dutch population is greying, while consumers are increasingly more ethnically diverse and often live in smaller households. This has led to demand for more convenience, a greater variety of foods and smaller packaging. The main trends include a growing demand for organic and sustainable products, and a growing interest in healthy and nutritious food products.
Foreign Agricultural Service,
US Department of Agriculture
This is an edited version of the GAIN Food Processing Ingredients Report published on April 14, 2020. The full report is available at: https://www.fas.usda.gov/data/netherlands-food-processing-ingredients-3
By gofb-adm on Wednesday, July 1st, 2020 in Issue 2 - 2020, Markets No Comments
The global economy slowed down in 2019, with the International Monetary Fund downgrading growth to 3% from 3.8% in 2018. Weak growth was driven by a sharp deterioration in manufacturing and trade activities, with higher tariffs and prolonged uncertainty over trade policy damaging investment sentiment and demand for capital goods.
In addition, the automobile industry contracted due to a variety of factors, such as disruptions from new emissions standards in the Euro area and China. The overall trade volume growth in the first half of 2019 fell to 1%, the lowest since 2012.
The European Parliament’s vote that adopted the Delegated Act – which mandates an earlier exclusion date for palm biofuels under RED II – was initially expected to have a negative impact on palm oil consumption. However, the converse occurred, as European consumption increased by 3.8% compared to 2018. This was driven mainly by the competitive price of palm oil over the first three-quarters of 2019. Almost two-thirds of the palm oil in Europe is used for energy – 53% of imports goes into biodiesel for vehicles, while 12% is used for generating electricity and for heating.
The Malaysian palm oil sector was able to curtail the impact of economic volatility through the discipline, commitment and teamwork of stakeholders. The oil palm planted area was recorded at 5.9 million ha in 2019 (Table 1). Without erratic weather patterns to affect productivity, crude palm oil (CPO) production rose by 341,826 tonnes (1.8%) compared to 2018. Production of crude palm kernel oil saw an increase of 22,199 tonnes (by about 1%).
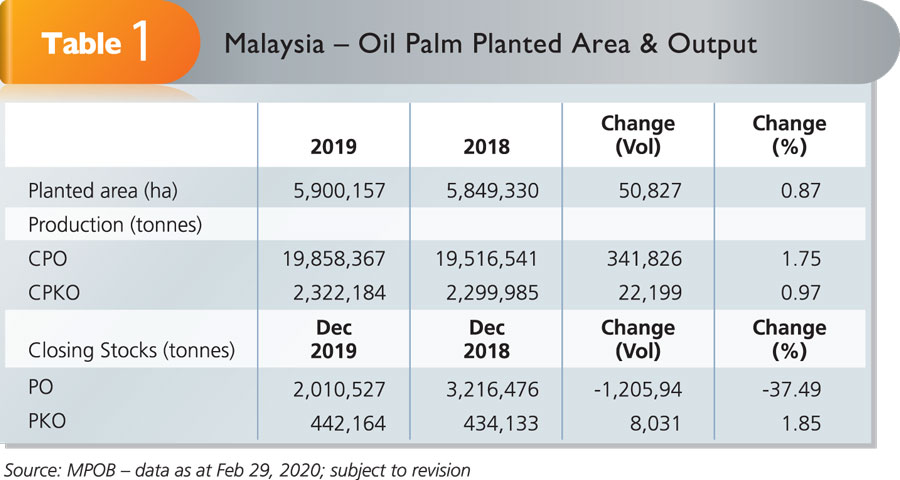
Although CPO production expanded during the year, the stock level in December declined significantly by 1.2 million tonnes, compared to 2018. This was primarily because of higher exports of palm oil and its products, fueled by the comparatively low price of palm oil, which had traded below RM2,000 per tonne between March and September. This widened the price discount with competing oils, such as soybean oil, sunflower oil and rapeseed oil, in the global market. The year-end stock level of palm kernel oil was slightly higher at 442,164 tonnes (up by 1.9%), compared to 2018.
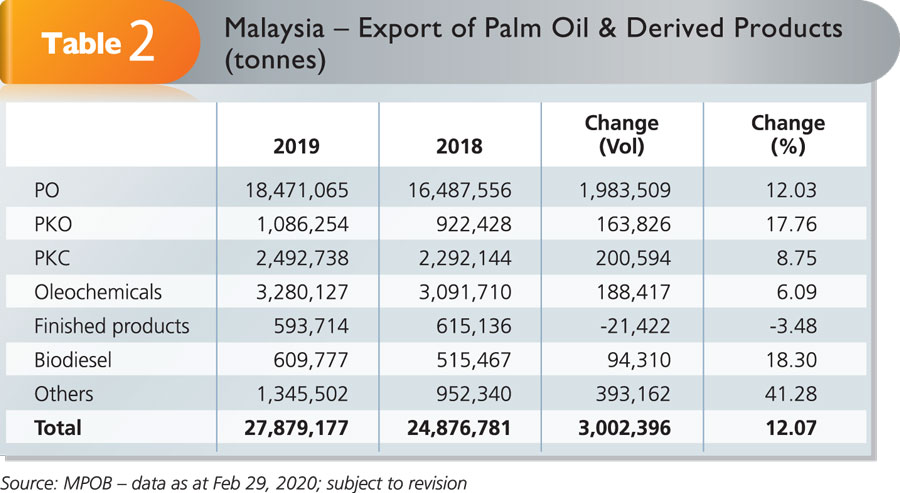
Malaysia’s exports of palm oil products increased by just over 3 million tonnes (12.1%) to register 27.9 million tonnes in 2019. With the exception of finished products, all other categories showed an increase in the export volume (Table 2).
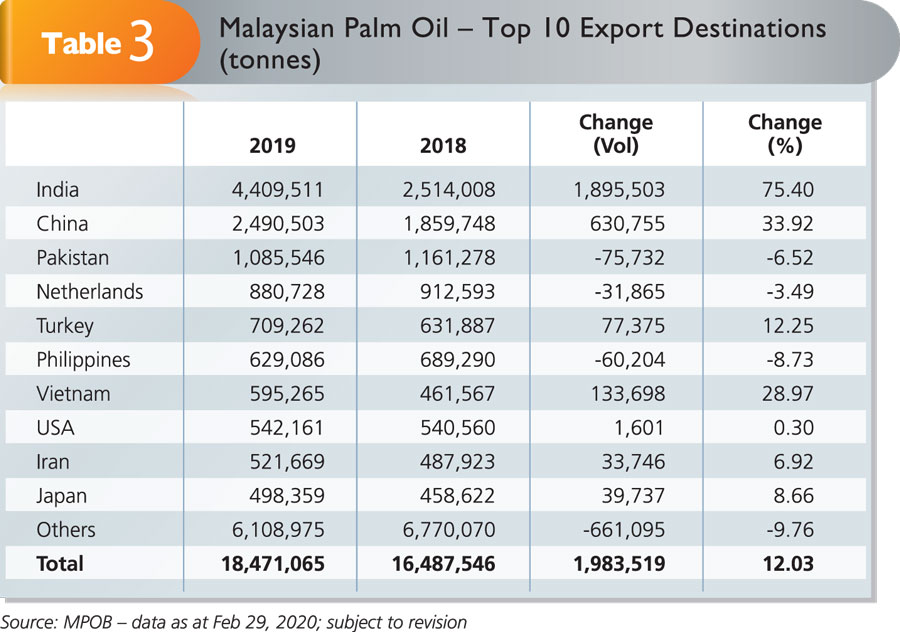
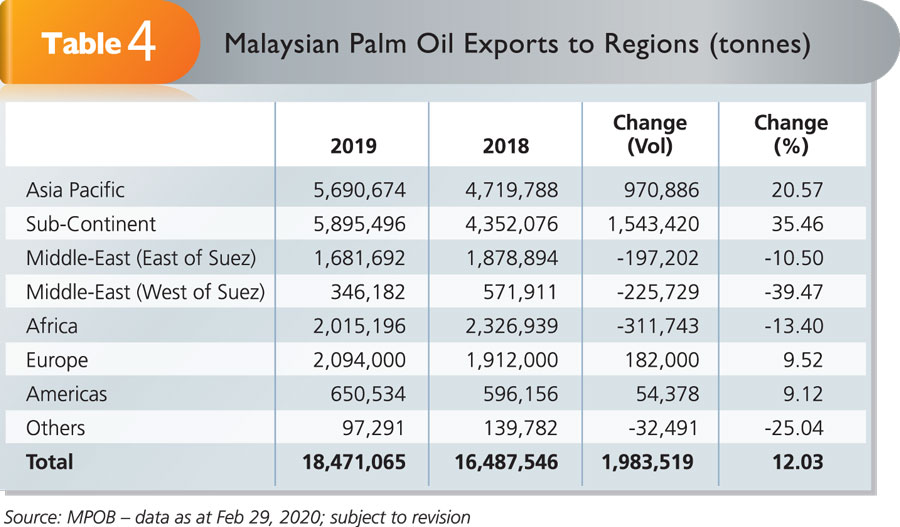
Total palm oil exports were recorded at 18.5 million tonnes (Table 3) and valued at RM41.6 billion. In terms of volume, this was close to 2 million tonnes (12%) higher compared to 2018; in terms of value, it was RM605 million or 1.4% more. The relatively smaller increase in value in 2019 was attributed to the low average price of palm oil in the second and third quarters of the year.
Export revenue
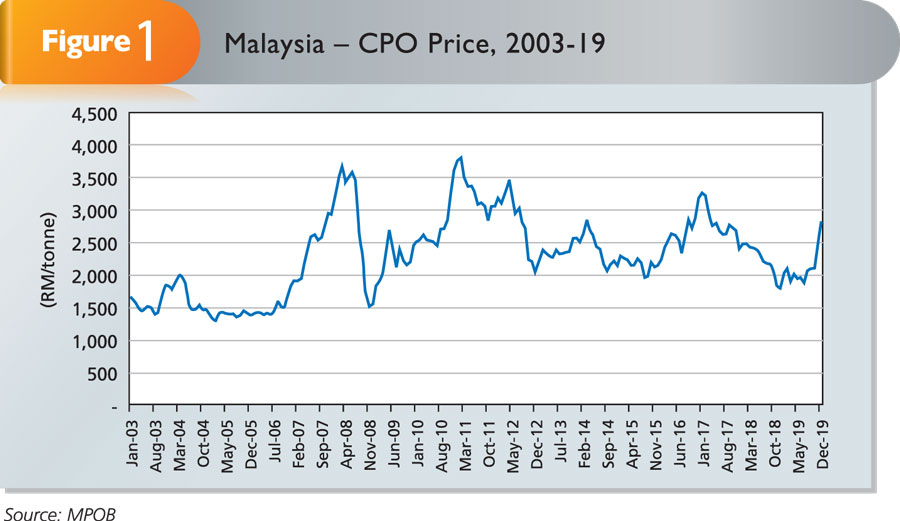
The trend of lower palm oil prices from June 2018 carried through into 2019. From March through October, the price hovered between RM1,900 and RM2,100 per tonne.
The annual average local delivered CPO price decreased by RM154 (6.9%) to RM2,079 per tonne in 2019 (Table 5), but it did not dampen the Malaysian palm oil industry. The price spread with soybean oil widened over this period, leading to higher demand for palm oil. This was reflected in Malaysian palm oil exports rising by about 12%.
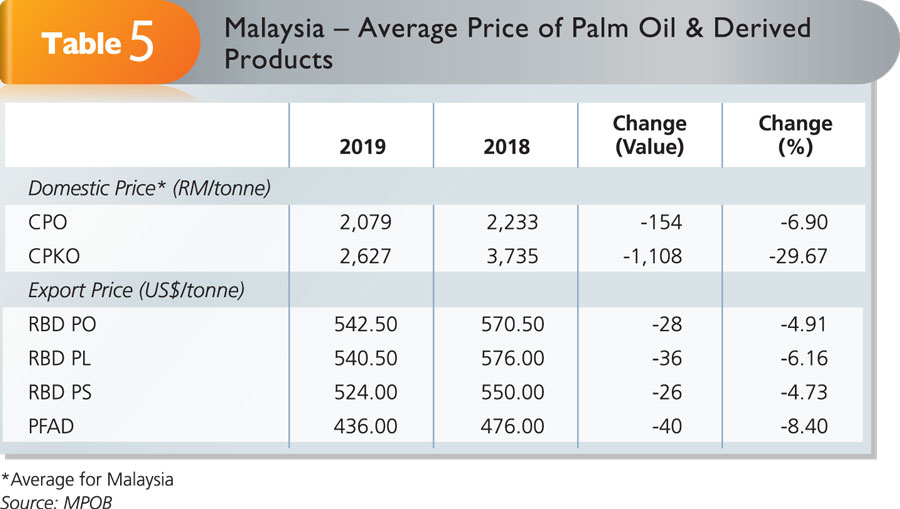
Improved demand for palm oil and competing oils stabilised the price of oils and fats worldwide. Low stock levels of Malaysian CPO helped strengthen the palm oil price, which inched higher from November to exceed RM2,500 per tonne. This pushed the average price to a respectable RM2,079 per tonne.
In 2019, Malaysia’s revenue from exports of palm oil products decreased by 2.6% to RM63.7 billion (Table 6). The larger volume of exports was offset by the lower price of palm oil, especially in the first half of the year. This was also true of all major vegetable oils worldwide – the price of soybean oil, for example, dropped by about 28%.
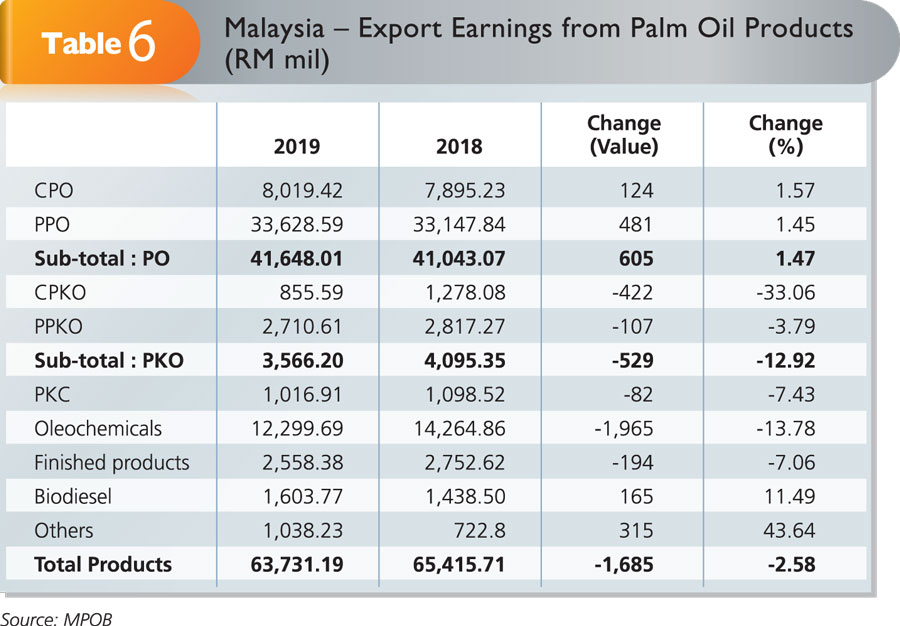
Export earnings from crude and processed palm oil went up by RM605 million (1.5%); biodiesel by RM165 million (11.5%) and other palm oil products by RM315 million (43.6%).
The proceeds were lower from palm kernel oil (by 12.9%), palm kernel cake (7.4%), oleochemicals (13.8%) and finished products (7.1%). However, some optimism returned when prices started to climb in the fourth quarter of the year.
Global trade in oils and fats
The world oils and fats trade was generally able to weather the economic challenges because of the rising popularity of edible oil as an essential part of the food and nutrition cycle. A surge in disposable income, coupled with increased consumption of processed food globally, were other contributing factors.
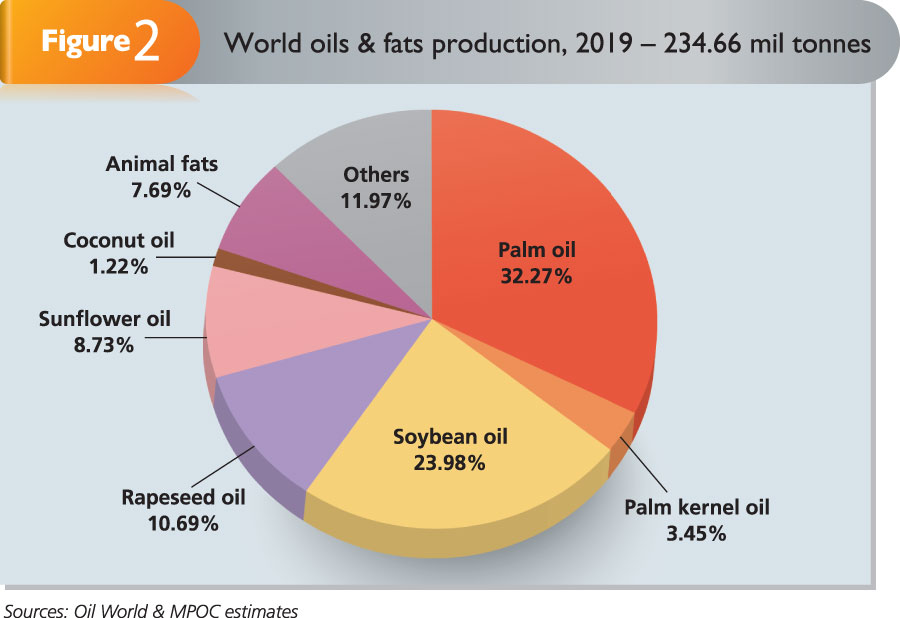
Global production of oils and fats stood at 234.7 million tonnes in 2019, a marginal increase of 1.3 million tonnes (by 0.6%) compared to 2018. Interestingly, oils and fats consumption of 237.1 million tonnes over the year exceeded production by 2.5 million tonnes. However, the high carryover stocks from 2018 cushioned the impact of this.
The combined output of palm oil and palm kernel oil accounted for 83.8 million tonnes, or 35.7%, of the total oils and fats volume (Figure 2). Soybean oil contributed 56.3 million tonnes (almost 24%), while rapeseed oil registered 25.1 million tonnes (10.7%).
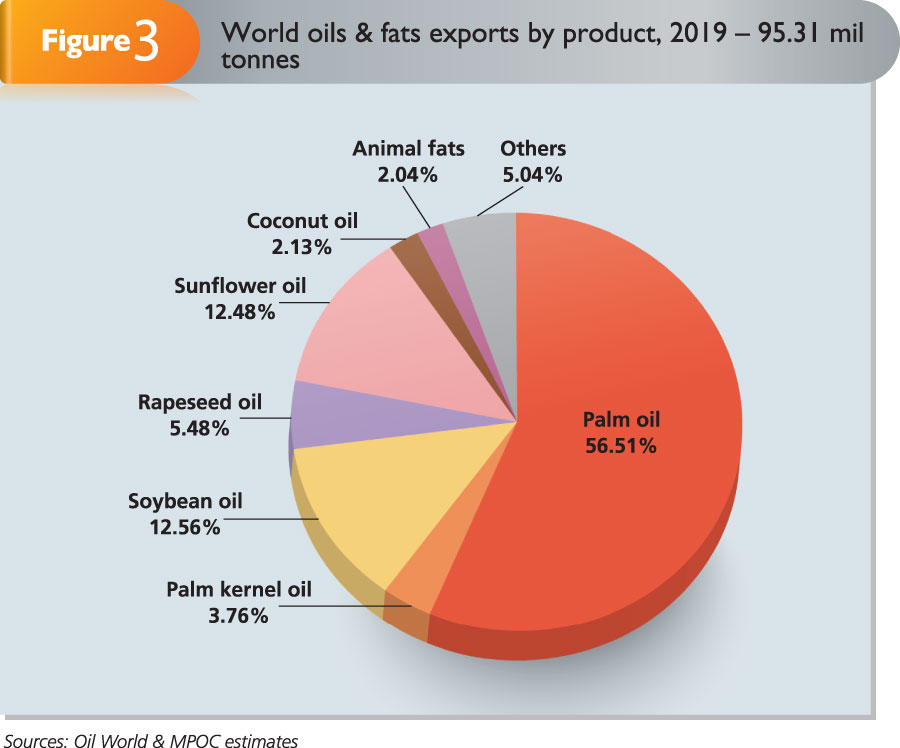
Of the 95.3 million tonnes of oils and fats traded worldwide, palm oil and palm kernel oil jointly made up 57.5 million tonnes – or 60.3% of the total volume (Figure 3).
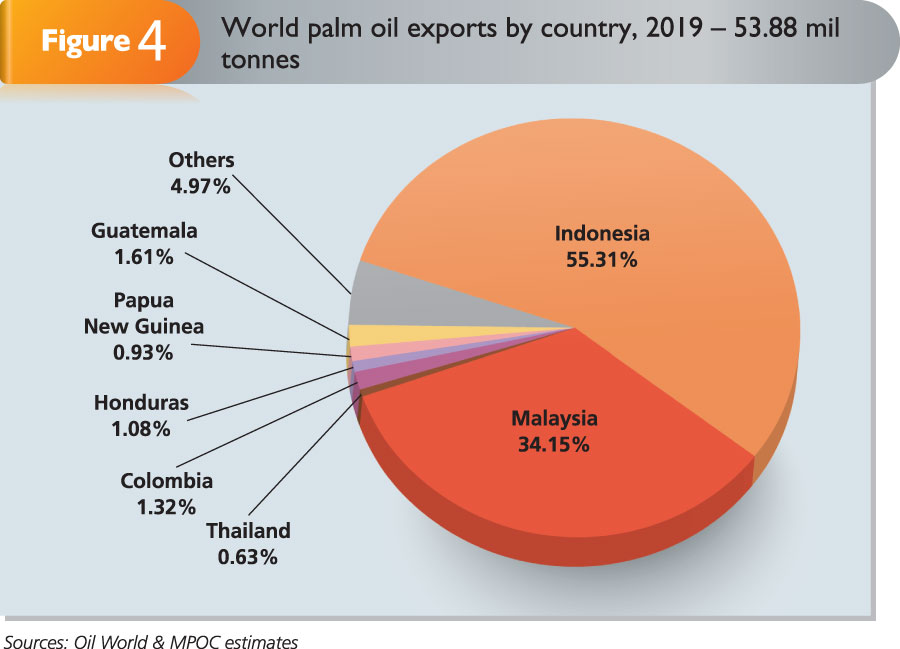
Malaysia remained a major player in the oils and fats export market. Its palm oil exports of 18.5 million tonnes represented 34.2% of the global palm oil trade (Figure 4).
MPOC
By gofb-adm on Wednesday, July 1st, 2020 in Issue 2 - 2020, Markets No Comments
The agro-based economy of Bangladesh accounted for 20% of the GDP in 2019. Cattle and poultry farming contributed about 1.5%. About 70% of the population of 169 million live in rural areas. They deem livestock farming to be an asset in food production, both to raise incomes and women’s employment, and to alleviate poverty.
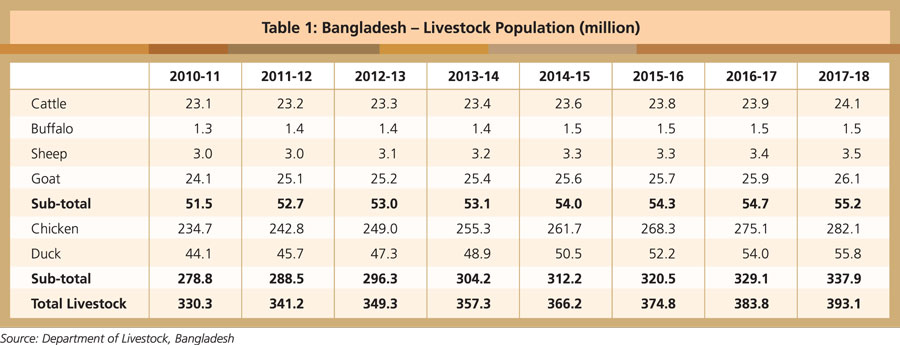
Due to increased demand, poultry, cattle and fish farms have gained prominence over the last two decades (Table 1). Alongside this, low-cost commercial feed production has experienced substantial growth over the last 10 years. This has, in turn, influenced demand for ready-mix feed, forcing the exit of smaller, low-quality producers with lower economies of scale. More than two-thirds of the market is dedicated to poultry feed. The cattle feed market remains the most under-developed of the three sectors.
Most dairy farmers mix home-made and commercial feed as a means of optimising costs. This is one area where Malaysian palm kernel expeller (PKE) and PKC/meal could perform well because of their competitive price.
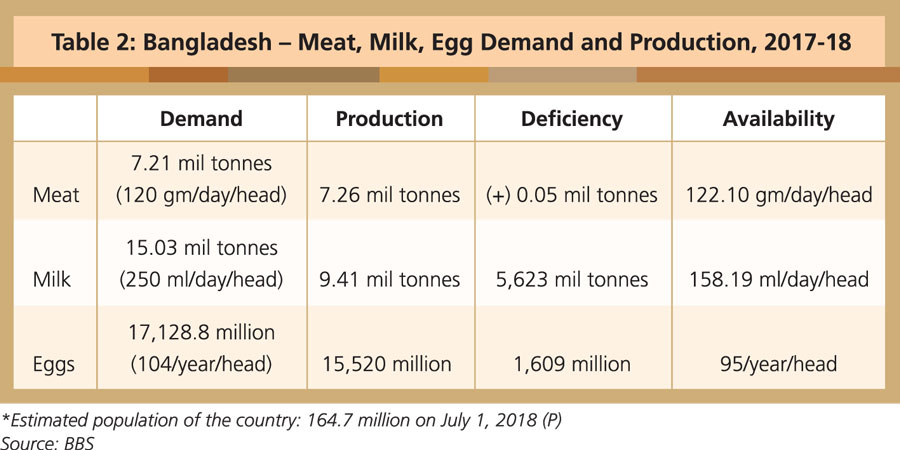
Annual demand growth for milk is estimated at 9-10%. Based on per capita meat and milk consumption, there is a latent demand of 50%. The Food and Agriculture Organisation puts per capita annual meat consumption in Bangladesh at 4.4kg against the recommended 10kg by World Health Organisation standards, while milk consumption is 158 ml against the recommended 250 ml per head per year (Table 2). As such, there are tremendous growth opportunities for the cattle farming and feed sectors.
Feed meal sector
Naturally grown grass has been a traditional component of fodder for cattle. Diversification to produce quality feed and fodder, as well as strengthening of the feed milling capacity and pasturage systems, would help to raise the productivity of livestock.
Bangladesh produces about 15,000-20,000 tonnes of molasses. It further makes about three million tonnes of soybean meal from domestic sources and imports, as well as oil cake from local oilseeds. Additional sources of feed come from 100,000-120,000 tonnes of paddy straw, fruit and vegetable waste annually. All these go into pre-mixed feed production, but this is still inadequate to meet demand.
The Bangladesh chapter of the World Poultry Science Association estimates that the current feed meal market-size is about 5.3 million tonnes, with annual growth of about 8-9%. Bangladesh’s commercial feed industry can be divided into three categories, each with two sub-categories (Table 3). Broiler poultry feed currently holds the strongest position, with an average market share of 47.2%. Aqua fish feed is next (20.8%), followed by layer poultry feed (19.8%) and cattle feed (12.3%).
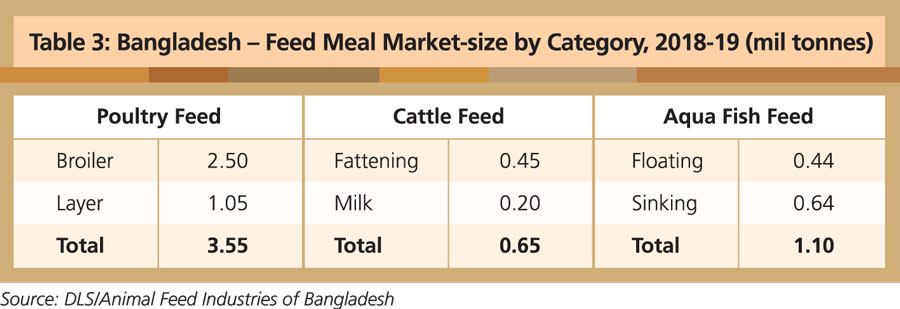
Although it makes up the largest segment, the broiler feed market is projected to grow the least. Fattening cattle feed, currently the smallest sub-segment, is expected to grow the fastest at a rate of about 15.5% annually, with milk cattle feed at a rate of 11.5%. Higher demand is being generated by Bangladesh’s steady economic growth of 7% in recent years, population growth, rapid urbanisation and change in dietary habits.
In line with the expansion of cattle farming, PKE imports have been growing quickly for the feed market. Imported PKE was introduced to Bangladesh a few years ago. Its price competitiveness and nutritional value are the main factors behind the demand growth (Table 4).
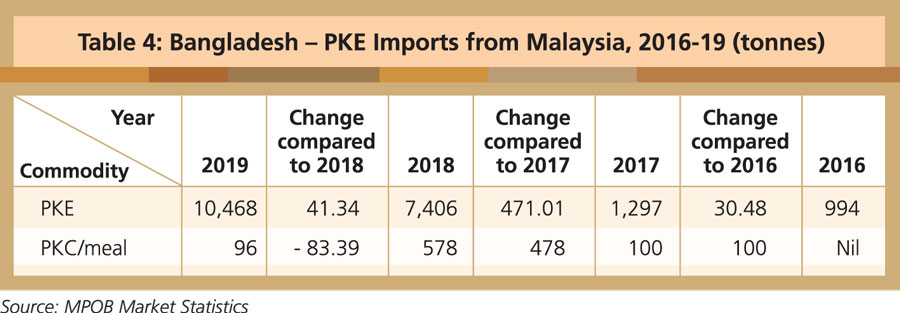
Malaysia is the only supplier of PKE and PKC/meal in Bangladesh at present. By educating cattle farmers, feed producers and formulation experts on the nutritional advantages and price competitiveness of PKE and PKC/meal, it could well command the market.
MPOC Bangladesh
By gofb-adm on Wednesday, July 1st, 2020 in Issue 2 - 2020, Environment No Comments
In December 2018, the European Union’s (EU) updated Renewable Energy Directive (RED II) entered into force. It set higher renewable energy targets for EU member-states and claims to ‘ensure robust [greenhouse gas (GHG)] emission savings and minimise unintended environmental impacts’.1 One element of RED II is the cap it places on the use of biofuels in the transport sector and, in relation, its targeting of emissions from so-called indirect land-use change (ILUC).2
Biofuels are renewable fuels made from plant or animal material. They can be used to replace non-renewable fuels. For example, biodiesel (a biofuel made mostly from renewable vegetable oils) can replace diesel (a fuel made from the non-renewable fossil fuel petroleum). Although biofuels release GHG, they release less than fossil fuels.
ILUC concerns a potential scenario where biofuel production indirectly releases significant GHGs. The scenario has three steps. The first is that demand for biofuel leads to existing agricultural land (producing food and feed crops) being converted to biofuel production. The second is that supply of food and feed crops decreases as a result, but the demand for food and feed crops remains the same. The third is that to meet this unmet demand for food and feed crops, the use of other land is changed – in particular, land with high carbon stock, such as forests or wetlands, is changed into agricultural land (by clearing or burning) releasing a large amount of GHG.3
The EU has expressed its concern that ILUC-related emissions could negate some or all of the GHG savings through biofuel use.4 RED II limits EU members’ ability to factor so-called ‘high ILUC-risk’ fuels into their calculations of renewable energy use in the transport sector to 2019 levels, and gradually reduce that share to 0% by 2030.5 The relevant effect is to set a renewable energy target, but to limit the biofuel consumption in the transport sector that a member-state can take into account when assessing whether it achieves that target. The EU has also implemented regulations setting out its methodology for determining whether a biofuel is associated with a high risk of ILUC.6
In a related press release, the EU notes that the data it relied on ‘show that palm oil has been associated with the highest level of deforestation’ as ‘over the period 2008-2015, 45% of the expansion of palm oil took place in high carbon stock areas’, which ‘is not even by far comparable to other feedstock’.7
Indonesia and Malaysia – the top two producers of palm oil – have raised concerns in relation to RED II in the Committee on Technical Barriers to Trade at the WTO. On March 13, 2019, Malaysia stated that this will result in ‘arbitrary and unjustifiable discrimination, in favour of other oil crops’, that it is ‘a disguised restriction on international trading of palm oil and its products’, and that the basis for determining high ILUC risk ‘lack[s] scientific data and reliable information’.8
Indonesia stated to the same Committee on July 1, 2019 that RED II will discriminate against biodiesels generated from palm oil vis-à-vis other biodiesel products produced within EU members, and will create unnecessary barriers to trade.9 The EU has stated that RED II complies with its WTO obligations, as it does not single out specific biofuels and does not limit the market access of imported biofuels to the EU.10
On Dec 16, 2019, Indonesia requested dispute settlement consultations with the EU concerning this and other related measures.11 Malaysia is also expected to initiate WTO dispute settlement proceedings,12 but has not yet done so. Consultations are the first stage in WTO dispute settlement; if the parties fail to resolve the dispute in this context, the complaining party(ies) can request that a WTO panel be appointed to hear the dispute.
While the EU is right that the text of RED II and its accompanying regulations make no mention of palm oil, or Indonesia and/or Malaysia (or indeed of any other country), WTO law precludes WTO members from discriminating ‘de facto’ against foreign products, or against products from one or more countries.
To the extent that palm oil-derived biofuels are in a competitive relationship with other food crop-derived fuels – such as the sugar and cereal crops that feed bioethanol production, or the other vegetable oils that are used in biodiesel, which do not have a high ILUC risk under the EU’s methodology – then the inquiry will turn on whether RED II changes the conditions of that competition in the biofuel market by disadvantaging palm oil-derived biofuels.
If RED II does discriminate against palm oil products, the case will turn on whether the EU can successfully make out a defence under the various exceptions in WTO law, such as for measures ‘necessary to protect human, animal or plant life or health’, or measures ‘relating to the conservation of an exhaustible natural resource’.
Complexities ahead
Several complexities arise in this respect. First, the EU identifies in RED II not only the reduction of GHG emissions as its objective, but also improving energy security, reinforcing technological leadership in the renewable energy field, and creating jobs and growth.13 Here, the EU would need to demonstrate that RED II addresses GHG emissions; if RED II is successful only in (for example) improving energy security through shifts in production to other feed crops (in particular those predominantly produced in the EU), it is unlikely that the measure will be validated by a panel.
Second, WTO panels and its Appellate Body have been reticent14 regarding whether there is an implied jurisdictional limitation on WTO members regarding measures to address public policy objectives in other countries. In this case, the difficulty would arise because the EU is adopting measures to address GHG emissions in palm oil-producing countries, related to the clearing of land.
This difficulty is compounded by the fact that the Kyoto Protocol limits parties to basing their National Emission Inventories (used to benchmark progress towards UNFCCC goals) on GHG emissions and removals taking place within their territories, and not in other jurisdictions.15 Endorsement of an EU measure that addresses an environmental concern in another country would, therefore, be a big step for WTO law, and a contentious one under international environmental law.
Third, the EU would need to justify the scientific basis upon which RED II distinguishes between palm oil and other biofuels. The EU has set out a review of scientific literature16 that considers the relative expansion of different feed crops; the complainants in any WTO dispute would undoubtedly challenge this. In particular, the EU would be in an awkward position were the complainants to adduce evidence of other feed crops – particular those produced within the EU – that could also be associated with a high risk of ILUC but that are not excluded by the ILUC thresholds identified in the EU’s methodology.
Fourth, RED II identifies whether a product carries a high ILUC risk based on historical data relating to the expansion of global production of a given biofuel into areas with high carbon stock. Although there are limited exemptions for low ILUC-risk biofuels, the measure nonetheless does not appear to accommodate the notion that specific palm oil biofuel may have been farmed sustainably, or on already cleared land, that did not push agricultural production onto other lands.
Put differently, there appears no way of accounting for any disjuncture between a general risk of ILUC and a given consignment of biofuel. This may make it difficult for the EU to demonstrate that RED II is sufficiently flexible to take into account relevant differences in conditions among, or even within, palm oil-exporting WTO members.
Finally, the EU’s justification of RED II would involve argumentation around the relationship between the measure and its intended objective – the required strength of this relationship will depend on the exception(s) that the EU invokes. Part of the analysis is likely to relate to the contribution that RED II makes to its objectives. Here the EU will have to grapple with the likelihood that reducing the extent to which EU members can rely on palm oil will likely shift demand towards other biofuels – all of which are less energy-rich and thus require more land for production.17
Unless the EU can demonstrate that increases in demand for alternative (non-palm oil) fuels will not drive additional land-clearing to account for the lower productivity of those substitutes, it may face difficulties demonstrating that RED II contributes to reducing GHG emissions associated with ILUC.
This dispute comes at a difficult moment for the WTO. The organisation is among US President Donald Trump’s favourite political footballs; it faces an institutional crisis with the expiration of the terms of two of the remaining three Appellate Body members on Dec 10, 2019, such that the organ can no longer hear appeals of panel reports.18
At a time when the legitimacy, and even the ongoing existence,19 of the WTO is being openly questioned, a dispute which (again) tests the limits of WTO law’s ability to sanction a measure that is purportedly directed towards environmental protection will only serve to compound the institution’s mounting difficulties.
Professor Andrew D Mitchell
Faculty of Law, Monash University, Australia
&
Dean Merriman
Senior Manager
Deloitte Australia’s Global Trade Advisory Practice
By gofb-adm on Wednesday, July 1st, 2020 in Issue 2 - 2020, Comment No Comments
With national borders closed and flights suspended to contain the spread of Covid-19, the global food supply chain stands threatened. Most governments have adequate stockpiles for now but, in the medium and long term, a food catastrophe lurks, especially for importers.
Already, the Food and Agriculture Organisation (FAO) has warned that a protracted pandemic could disrupt the entire food web, affecting everyone from farmers and processors to retailers.
In addition, as many as 265 million people around the world are facing food insecurity and possible starvation, aggravated by the pandemic. The hardest hit are the poorest in society, because demand for food is inextricably linked to income. Loss of employment leads to loss of income; in turn, this affects consumption.
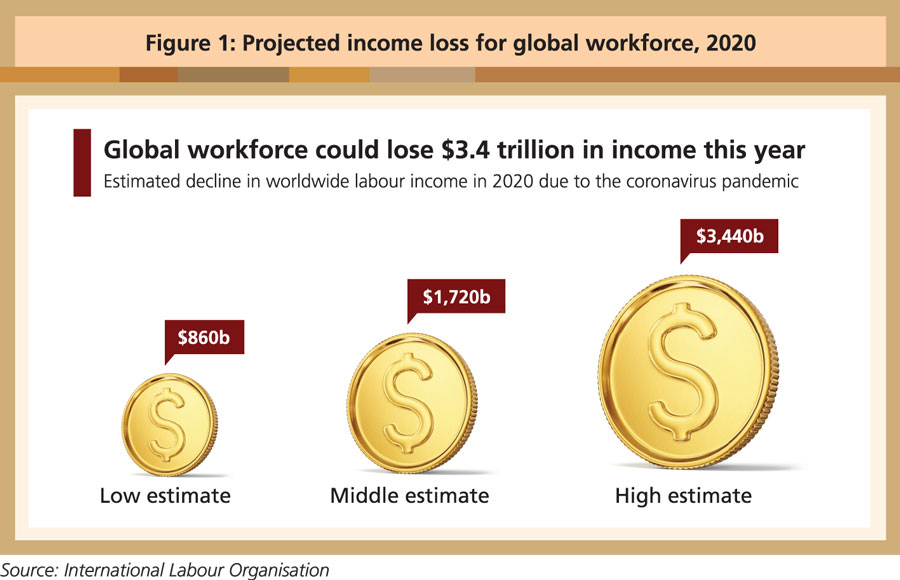
The International Labour Organisation (ILO) estimates that the pandemic will push millions of people into unemployment, underemployment and working poverty. According to its estimates, workers could lose between US$860 billion and US$3.4 trillion in labour income this year alone (Figure 1).
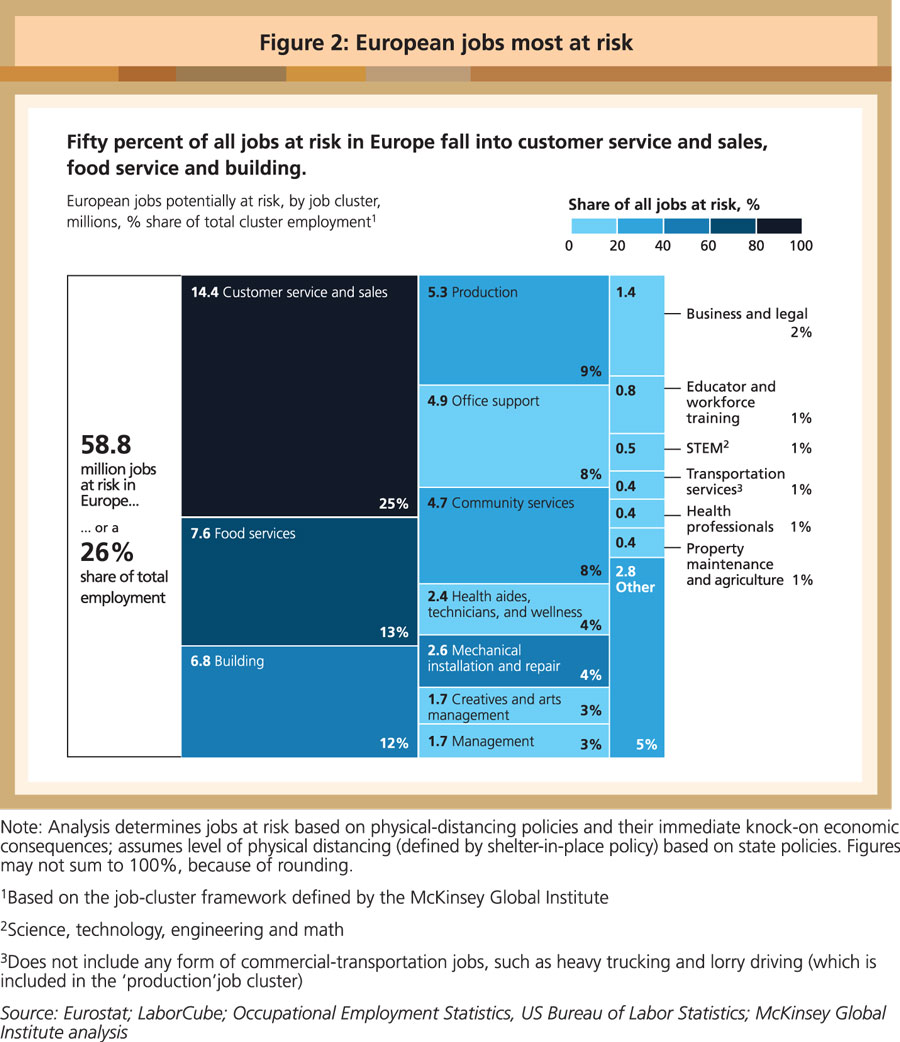
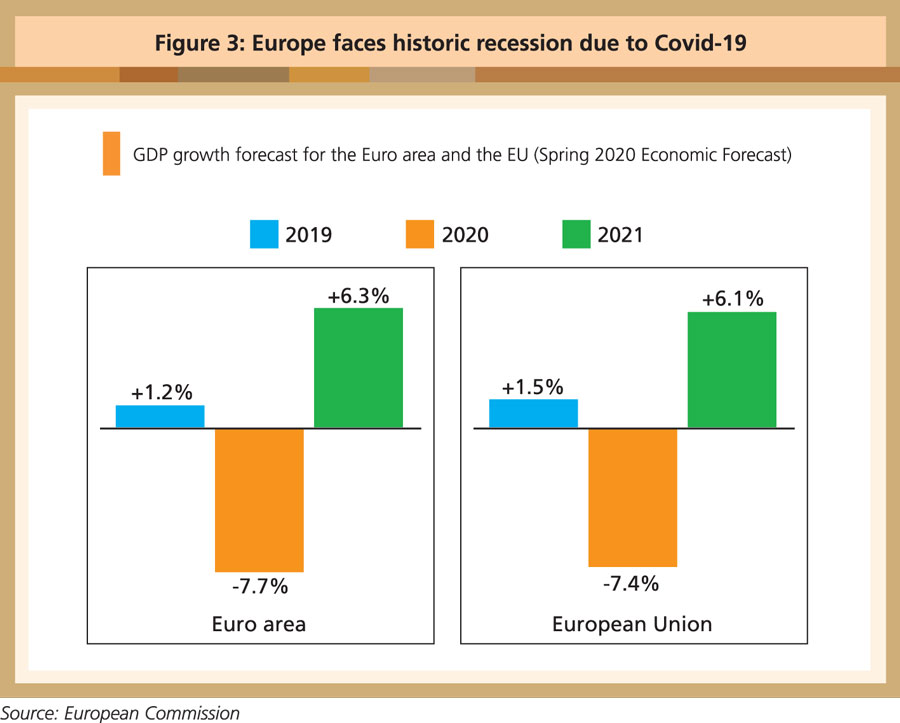
A McKinsey survey estimates that up to 59 million jobs are at risk in Europe (Figure 2) – a staggering 26% of total employment in the 27 member-states of the European Union plus the UK. The European Commission projects GDP contractions of 7.7% and 7.4% respectively or the Euro area and the EU this year, down from previous estimates of 1.2% and 1.4% growth (Figure 3).
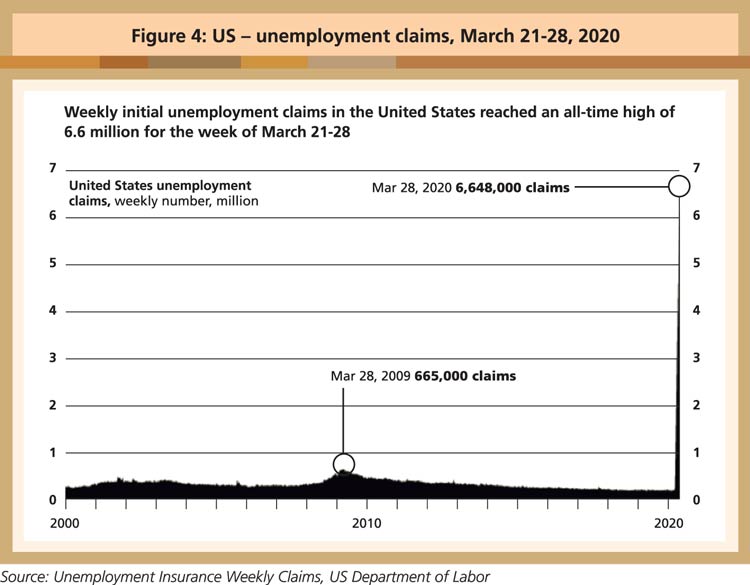
A bleak picture also appears in the US where unemployment claims for the week ending March 28 reached 6.6 million (Figure 4). McKinsey estimates that, prior to the Covid-19 outbreak, about 37 million Americans faced food insecurity. Since the beginning of the outbreak and with the increase in unemployment, an additional 17 million people face food insecurity. That’s a 46% increase.
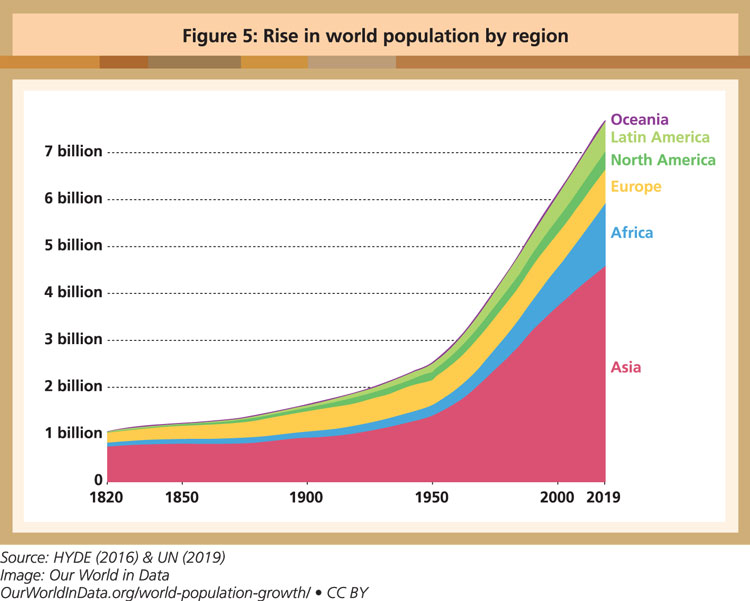
The FAO has sounded the early warning that the agri-food sector will need to generate 50% more food within the next 30 years. A World Resources Institute report outlines that global food production will have to increase by 50% to feed the world’s 10 billion people in 2050.
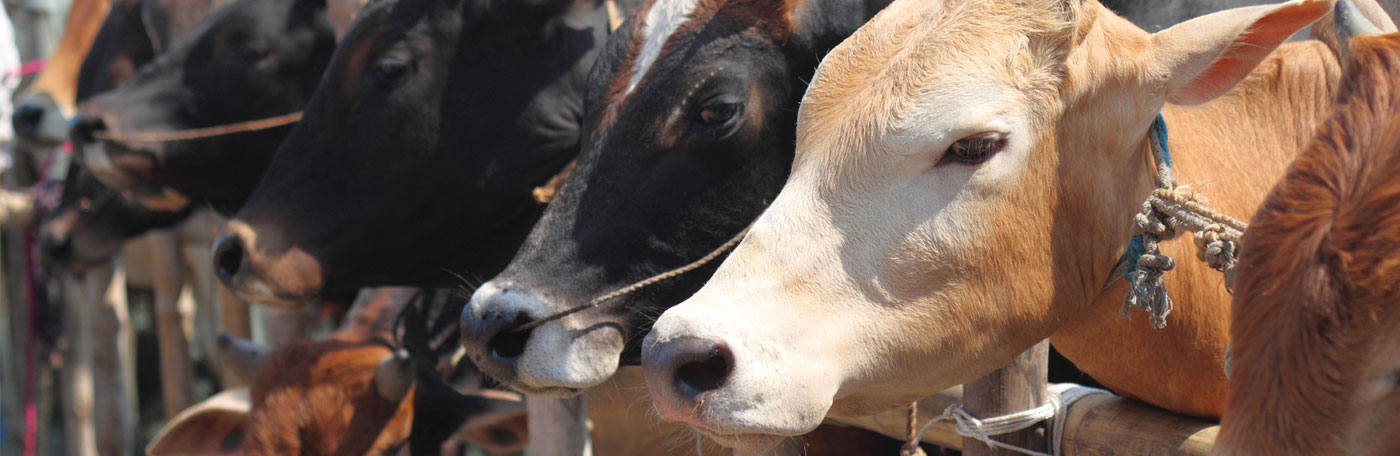
Agro-based economies therefore have no choice but to keep their food supply chains moving, despite the difficulties posed by the Covid-19 pandemic. However, their activities continue to be scrutinised through the restrictive lens of the environment impact of food production. Food waste and the livestock sector are considered the main emitters of greenhouse gas (GHG) emissions.
‘Local or global’ debate
In ensuring low carbon food for the table, concerns have been raised in particular about transportation and whether locally produced food can lower the rate of emissions. Critics claim that trade in food is bad for the environment due to ‘food miles” – a reference to the carbon footprint caused by transporting agricultural food products over long distances.
The concept, which originated in the UK in the 1990s, refers to the distance that food is transported from the time of production till it reaches the consumer. It is an indicator of sustainability that pushes for local production and local consumption.
Els Wynen and David Vanzetti, in their paper, ‘No Through Road: The Limitations of Food Miles’, explain that the attraction of the food miles concept can be attributed to several factors – reduced transport costs; new technologies; and demand for out-of-season, processed (pre-packaged), and perishable products.
However, the concept is also considered to be flawed because it ignores the cost of production; the mode and scale of transport; and the importance of other inputs such as capital and labour.
The authors note that some product lifecycle studies have found that the greatest energy use occurs when moving the produce from the retailer to the consumer. Consumers often drive an empty car to a shop, then drive home with 5-10kg of groceries in a one-ton vehicle. The energy use per kilogramme is greater than the cumulative production and distribution costs up to that point.
In his paper, ‘Privileging Local Food is Flawed Solution to Reduce Emission’, Christophe Bellmann of the Hoffmann Centre for Sustainable Resource Economy explains how the concept of food miles is often invoked to restrict trade and support locally-produced food over imports. In this sense, it can be viewed as a trade protectionist measure to protect local farmers from competition.
Eating local may not be the best way to reduce the carbon footprint. Bellmann notes that consuming local food may make sense initially in reducing the carbon footprint and helping to generate employment. But this often ignores the emissions produced during the stages of production, processing and storage.
The mode of transport and seasonality can affect outcomes as well. For example in the US, food items travel more than 8,000km on average before reaching the consumer. Yet transport only accounts for 11% of total emissions, with 83% – mostly nitrous oxide and methane emissions – occurring at the production stage.
Therefore, from an environmental perspective, it may be better to consume lamb, onion or dairy products transported by sea, because the lower emissions generated at the production stage offset those resulting from transport.
Consumers sometimes prefer travelling some distance just to get fresh produce. Bellmann explains how driving more than 10km to purchase 1kg of fresh produce will generate proportionately more GHG emissions than air-freighting 1kg of produce from Kenya.
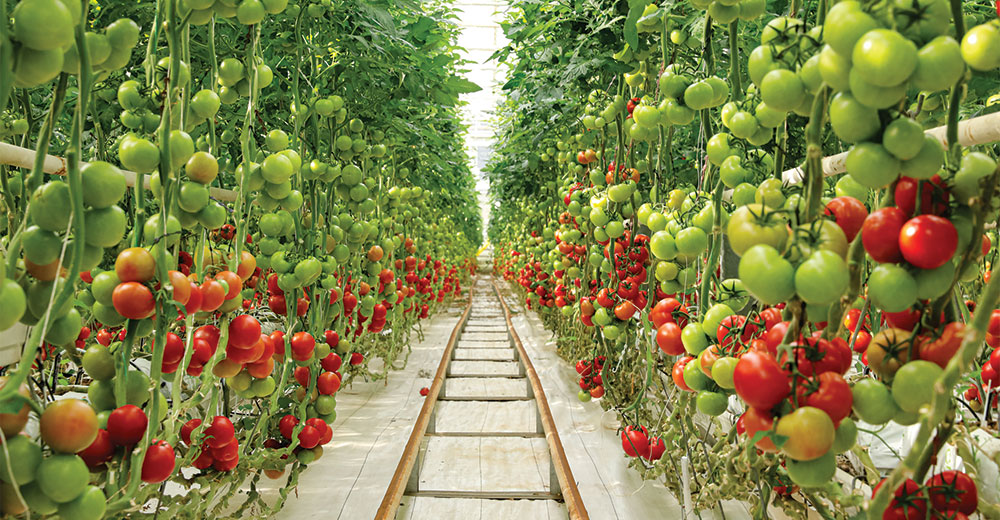
Similarly, growing tomatoes under heated greenhouses in Sweden is considered more emissions-intensive than importing open-grown ones from southern Europe. In term of seasonality, placing British apples in storage for 10 months leads to twice the level of emissions than that of South American apples sea-freighted to the UK.
Today, the major challenge in food production is not just about meeting niche demand, but also about fulfilling the over-arching needs of society and the economy at large. For this reason, food trade corridors must remain open to ensure the continuous functioning of supply chains to feed the world.
This is certainly not the time for countries to act individually or to protect their own interest, as they work out the post-pandemic ‘new normal’ for economic sectors, including food production. Protectionist policies, tariffs and export bans should be avoided. Instead, health and economic well-being should remain a priority.
Belvinder Sron
Deputy CEO, MPOC