


The global economic uncertainties of 2017 continued into 2018. The year was punctuated by escalating trade disputes, especially between the US and China, and episodes of financial stress and volatility amidst an undercurrent of geo-political tensions.
This exposed the global oils and fats trade to a confluence of risks including intensifying climate challenges, which could severely disrupt economic activity and inflict significant damage on longer-term development prospects. The situation was exacerbated by the European Parliament’s vote proposing an earlier exclusion date for palm oil biofuels in the Renewable Energy Directive II mandates. The EU has used uncorroborated scientific evidence to support its baseless claims.
This protectionist policy is a politically motivated defensive measure that runs counter to the UN Charter, which promotes fair globalisation and a peaceful, prosperous future for all – one in which no one is left behind. The EU’s protectionist policy will hurt those with the thinnest margins of security – vulnerable small farmers, not only in Malaysia but in all palm oil producing nations. It will result in steep reductions in income inequality and act as a severe impediment to social development for the very communities compromised by EU’s lopsided decisions.
As the global outlook darkens, the imperative of sustaining economic momentum will require the Malaysian palm oil industry to make the most out of growth opportunities, avoid pitfalls and build buffers against possible future shocks.
In 2018, Malaysian palm oil was subjected to volatile global trade, as well as weather uncertainties that impacted production and exports. Nevertheless, Malaysia managed to curtail the impact to a minimum; this was achieved through discipline, strong commitment and teamwork among all stakeholders.
The domestic oil palm planted acreage was recorded at about 5.9 million ha in 2018, a growth of 38,185 ha (0.7%) compared to 5.8 million ha in 2017 (Table 1). As a result of erratic weather patterns, crude palm oil (CPO) production fell by 402,970 tonnes (2%) compared to 2017.
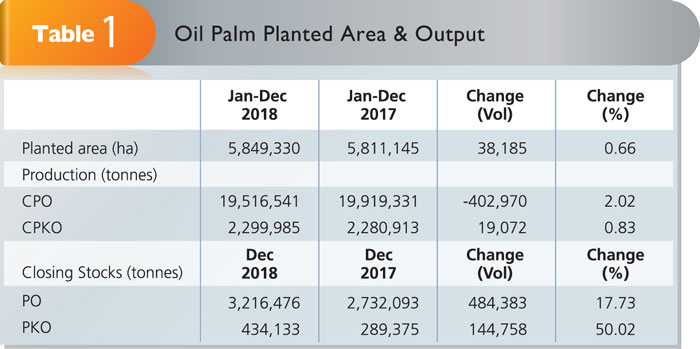
Source: MPOB – data as at Feb 18, 2019; subject to revision
Although the first quarter saw higher production, dry and hot conditions from April to September resulted in lower CPO production for the year. Despite improving weather conditions in the fourth quarter, the higher production of Q4 could not compensate for lower production in Q2 and Q3. On a positive note, production of crude palm kernel oil was recorded at 2.3 million tonnes, an increase of 19,072 tonnes (0.8%) compared to 2017.
Although CPO production went down in 2018, stock levels reached an all-time high of 3.2 million tonnes in December, largely due to lower exports. This situation was aggravated by the narrowing price discount between palm oil and competing oils such as soybean oil, sunflower oil and rapeseed oil in the global market. Year-end stock levels of palm kernel oil were recorded at 434,133 tonnes (up by 50%) against 289,375 tonnes a year earlier.
Exports of all types of palm oil products stood at 24.9 million tonnes (Table 2), an increase of 902,256 tonnes (3.8%). With the exception of palm oil and palm kernel oil, other products registered an increase in export volume. Palm kernel cake exports increased by 85,487 tonnes (3.9%), oleochemicals by 317,475 tonnes (11.4%), and finished products by 208,866 tonnes (51.4%). Palm biodiesel exports rose by an impressive 280,176 tonnes (119.1%) due to the favourable price and higher demand from China.

Source: MPOB – data as at March 31, 2019; subject to revision
Malaysian palm oil exports registered 16.5 million tonnes (Table 3) and were valued at RM41 billion in 2018. This was lower by 72,410 million tonnes (0.4%) in volume and almost RM9 billion (17.9%) in value compared to 2017. The decline in value was attributed to low average prices of all global oils and fats, which affected the export prices of palm oil as well.

Source: MPOB – data as at Feb 18, 2019; subject to revision
Export destinations
India retained its position as the main destination for Malaysian palm oil with 2.5 million tonnes, an increase of 485,711 tonnes or close to 24% year-on-year. This was due to the suspension of Malaysian export duty on CPO in the first quarter. It was the third consecutive year that India was the top destination for Malaysian palm oil. Despite the Indian government’s decision to increase import duties on palm oil three times between March and May, CPO imports stayed in positive territory due to high demand from refiners.
China was the second-biggest destination for Malaysian palm oil with an import volume of 1.9 million tonnes, albeit a decrease of 57,540 tonnes or 3% compared to 2017. China’s palm oil stocks had depleted by end 2017, which saw importers start procuring palm oil in the first half of 2018. However, demand tapered off when there were adequate stocks subsequent to the large purchases.
Pakistan was the third-biggest importer with 1.2 million tonnes, an increase of 144,301 tonnes or 14.2%. Malaysian suppliers were very competitive in offering attractive prices for palm olein during the first half of 2018, leading to a significant market share.
Asia Pacific and the Sub-Continent were the marketing regions that took up the bulk of Malaysian palm oil in 2018 (Table 4). They respectively imported 4.7 million tonnes and 4.4 million tonnes. This accounted for 55% of Malaysian exports.

Source: MPOB – data as at Feb 28, 2019; subject to revision
The Sub-Continent was the only region that recorded an increase in Malaysian palm oil imports – amounting to 697,442 tonnes (up by 19.1%). This was due to rising intake by India, Pakistan and the Central Asian Republics.
All other regions showed a drop – the biggest was seen in Asia Pacific, by 462,711 tonnes or 8.9%. The main reason was lower imports by Vietnam, the Philippines, Myanmar and Japan. Vietnam crushed a large quantity of soybean for the feed industry that saw an oversupply of soybean oil. In the Philippines, an increase in coconut production and better yield resulted in higher availability of coconut oil.
Export revenue
The annual average local delivered CPO price decreased by RM544 (19.5%) from RM2,783 per tonne in 2017 to RM2,239 per tonne in 2018 (Table 5). Lower exports and higher production of competing oils adversely affected the overall global oils and fats prices. The higher stock levels of CPO in Malaysia further dampened the price.

*Average for Malaysia
Source: MPOB
The average export price of RBD palm oil and RBD palm olein went down respectively from US$670.50 to US$570.50 (by 14.9%) and from US$686 to US$576 (by 16%) per tonne. RBD palm stearin and Palm Fatty Acid Distillates recorded lower prices as well, from US$659.11 to US$550 (by 16.6%) and from US$637.50 to US$476 (by 25.3%) per tonne respectively.
The overall value of palm-based exports decreased by 12.5% from RM74.7 billion to RM65.4 billion (Table 6). This was mainly due to lower prices of oils and fats, particularly in the second half of 2018. However, there was higher revenue from exports of palm cake (by 19.2%), finished products (49%), biodiesel (84.4%) and other products (39.5%).

Source: MPOB – data as at Feb 28, 2019; subject to revision
Global production and trade
World production of oils and fats stood at 231.2 million tonnes in 2018, an increase of 8.8 million tonnes from 2017. Palm oil and palm kernel oil together accounted for 80.3 million tonnes, or 34.8% of total oils and fats production (Figure 2). Soybean oil output contributed 56.4 million tonnes (24.4%) and rapeseed oil registered 25.6 million tonnes (11.1%).

Source: MPOB

Source: Oil World & MPOC estimates
Of the 88.3 million tonnes of oils and fats traded worldwide during the year, palm oil and palm kernel oil jointly contributed 53.5 million tonnes or 60.6% of global supply (Figure 3).

Source: Oil World & MPOC estimates
Malaysia retained its position as a major player in the oils and fats export market. Its palm oil exports of 16.5 million tonnes represented 32.8% of the global palm oil trade (Figure 4).

Source: Oil World & MPOC estimates
MPOC