


The US is one of the world’s major consumers of oils and fats. Its total consumption in 2017 amounted to 22.5 million tonnes, comprising mainly soybean oil, canola oil and corn oil. The US has a relatively low palm oil per capita consumption, owing to the dominance of domestic soybean oil and corn oil in the edible oils market. Palm oil consumption amounted to about 1.4 million tonnes in 2018.
However, the volume of palm oil imports has been rising. The Department of Agriculture indicated that palm oil imports increased by about 17% on annual average between 2000 (182,000 tonnes) and 2017 (1.7 million tonnes). The value went up by 3.4% to US$1 billion from January to November 2018, against US$967.04 million over the same period in 2017, according to WorldCity’s analysis of the latest US Census Bureau data. Malaysia’s market share constituted 38% of the total value.
The East Coast states of the US are the main gateways for palm oil imports, with the top three being the Port of New Orleans (37% of the total import value), Port of Savannah (25%) and Port of Newark (13%). Concentration in the East Coast states has limited the opportunity to expand palm oil demand and consumption in the West Coast, where California is a major market.
The US consumes about 10% of the world’s fats and oils for both food and non-food uses, including biodiesel and fatty acids production. The US remains the biggest market for palm oil in the Americas region, accounting for 91.5% of all palm oil imports.
From January to December 2018, the US absorbed 540,509 tonnes of Malaysian palm oil products (Table 1). This was a slight decrease of 2.5% compared to the volume recorded in 2017.
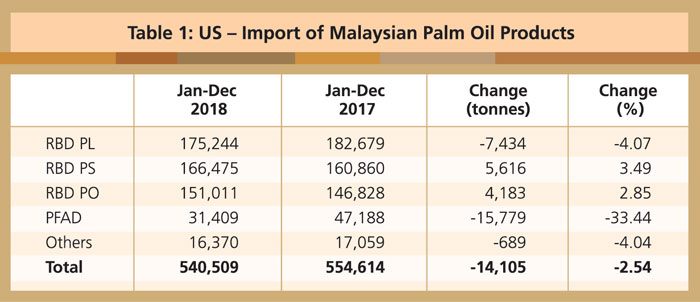
Source: MPOB
RBD palm olein remained the largest palm oil product imported in 2018, followed by RBD palm stearin and RBD palm oil (Figure 1).
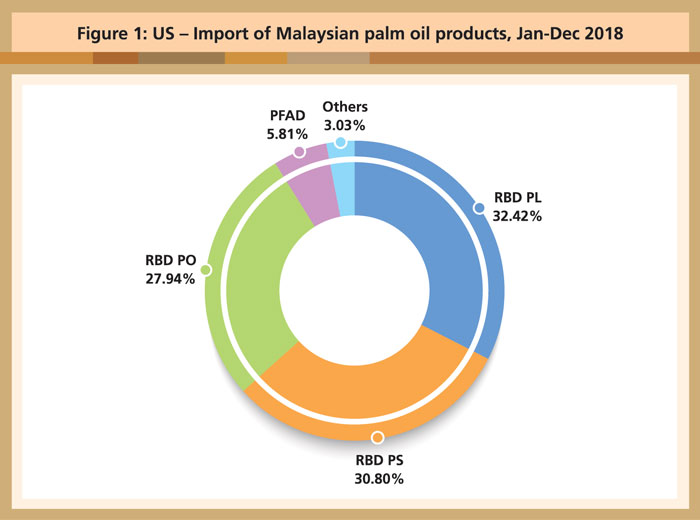
Source: MPOB
Soybean oil continues to be the most commonly used edible oil in the US. In 2017, soybean oil made up 9.1 million tonnes or 40% of the edible oils consumed domestically. However, canola, corn and palm oil have each grown at a faster rate than soybean oil. From 2011-16, use of these three commodities grew by 66%, 57% and 21% respectively, while soybean oil use increased by 11%.
Uncertainties ahead
China is the main importer of US soybean, accounting for 60% of total soybean exports to the country. The Chinese government’s decision to impose a 25% import tariff on US soybean has had a mixed effect on the stock balance and prices in both countries.
The trade dispute between the US and China has not made any significant impact on palm oil imports. However, the lag effect could see higher palm oil uptake by the US due to the attractive current price of palm oil.
There are no immediate indications as to how the reduction of soybean exports to China will affect the demand for palm oil in the US. It is also not clear whether the reduction in US exports will lead to increased domestic crushing of soybean; if so, it will in turn reduce the need for palm oil. The trade dispute may also affect the oils and fats balance in the US, thereby having a long-term effect on palm oil imports.
MPOC USA